Reducing Risk During a Sprint
A Typical Sprint Structure
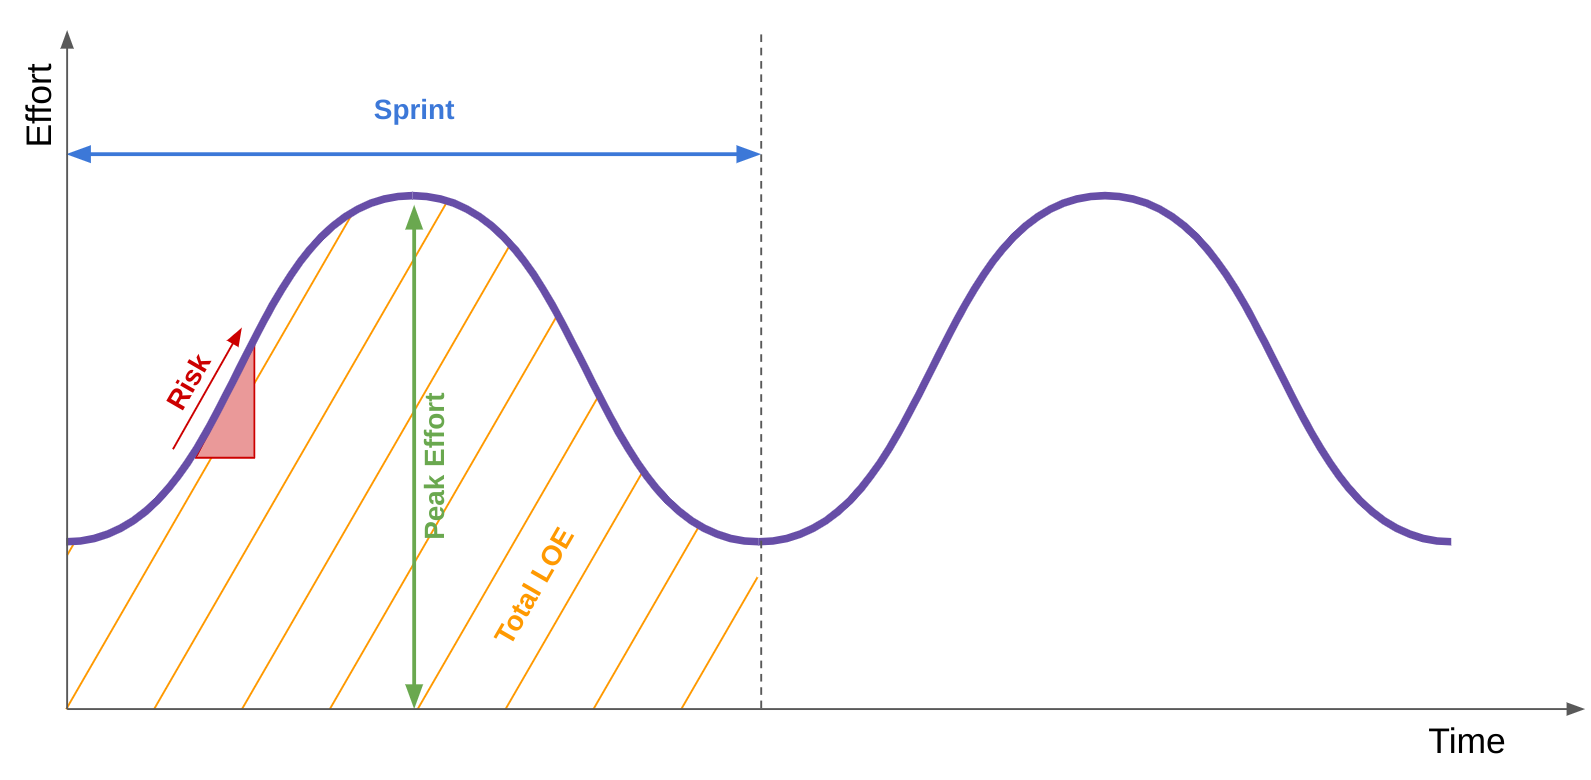
All sprints have a shape that can be graphed based on the total effort exerted over the total time. A typical sprint structure is divided into two (or more) cycles of drastic increases and decreases of effort exerted over short periods of time. On a graph, this typical sprint looks like two hills with a valley. Certainly not a walk in the park.
This shape occurs because a project team wants to create dramatic results in a short amount of time. With this cycle the team will complete their initial goals, but at the risk of burning themselves out by exerting a level of effort which is unsustainable.
Without properly laying out a roadmap for the project, this flash-in-the-pan method will result in a drastic dip in production, causing the team to fall into this valley of low effort.
At this point, the team’s efforts are halted while their work is checked for quality and plans are created for the next cycle. With a deadline looming over the team, they will burn the candle at both ends as they make a mad dash to complete the work on time.
Associated Risks of a Sprint
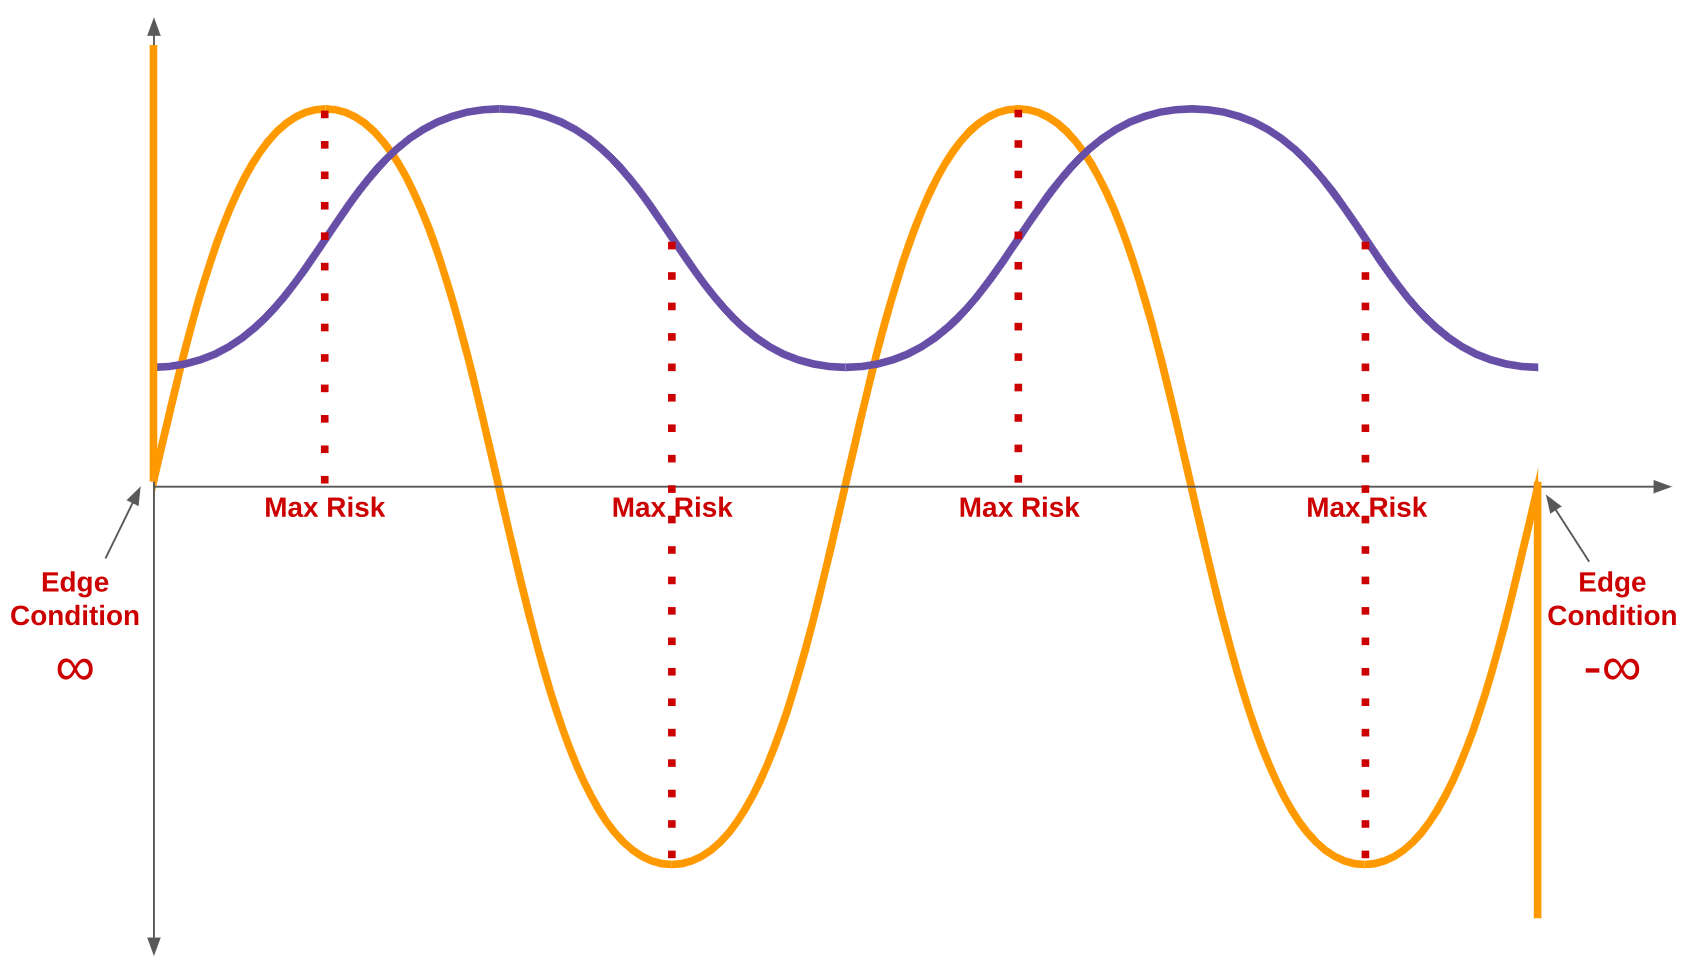
The same way we can graph the shape of a sprint, we can measure the associated risk of a sprint by calculating its slope. For our purposes, an associated risk means any consequence of an action that may result in an increased cost or delay in the project timeline. Simply put–the more dramatic a change is, in a shorter period of time, the higher the associated risk is for that change.
We can see from the cycles of a typical sprint that the process is primed with associated risk. The associated risk is highest at a cold start, a cold stop, and at the most drastic periods of change.
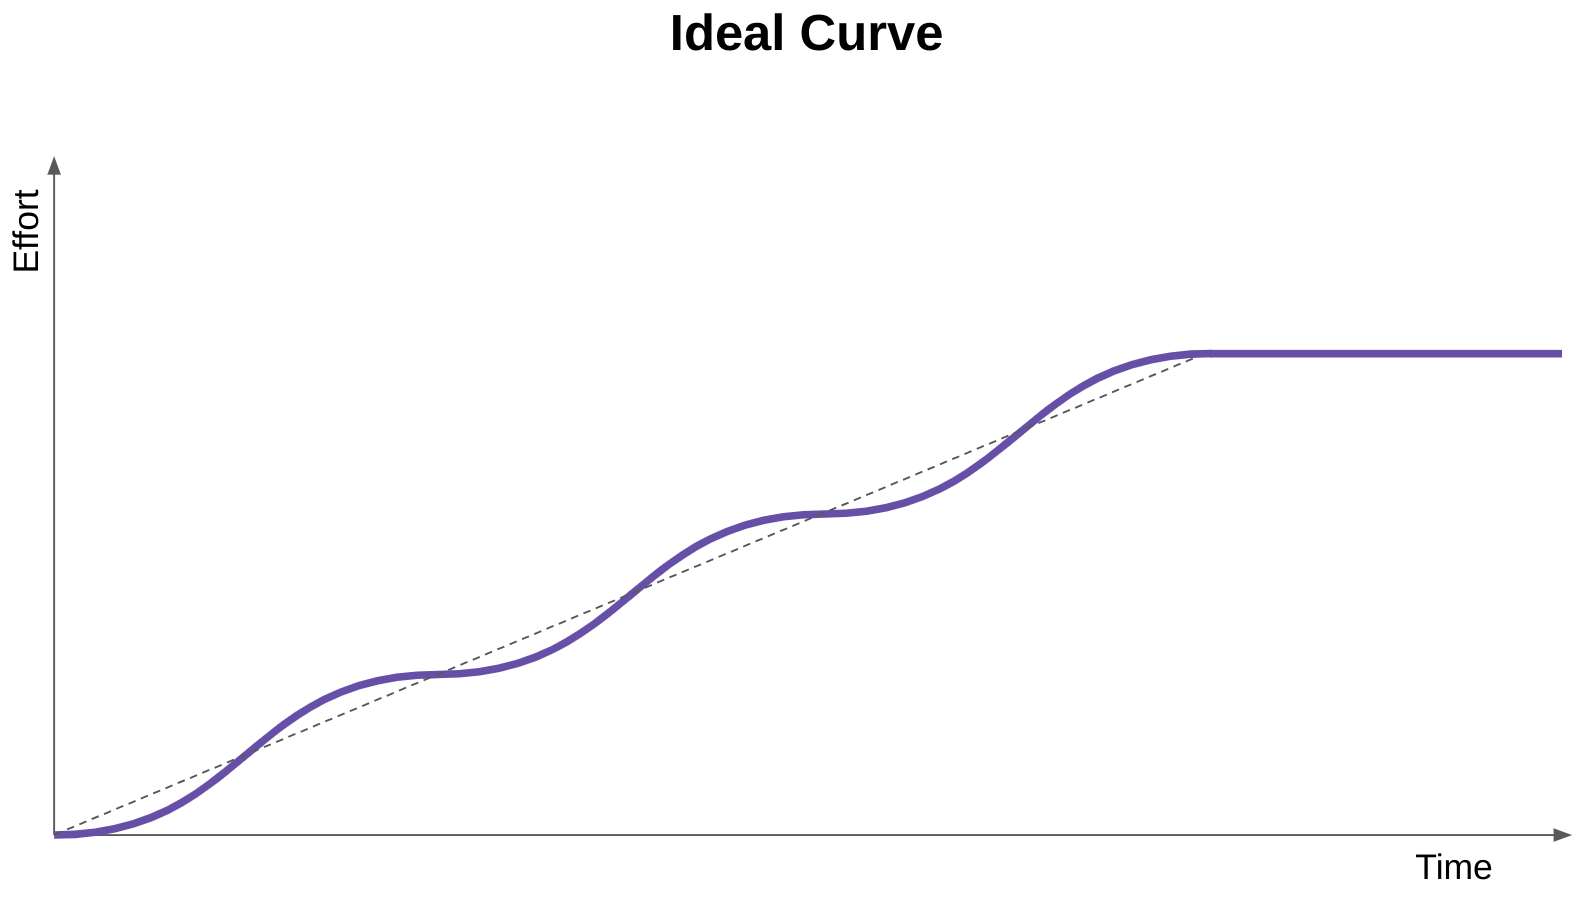
The ideal process eliminates these cold starts and stops by working closely with customers to plan out the sprint. In the ideal sprint, your team will experience the same collaboration and gradual transition with the final handoff as they did during the initial pass off.
A flatter curve will create a sustainable sprint process that accomplishes the project’s goals sooner and in a smoother, more sustainable way. A successful business will plan their sprint to create the ideal sprint structure that reduces these periods of dramatic change and eliminates risk.
The Ideal Sprint Structure
If you graph the ideal sprint on a chart, you will see that the structure is a stable and gradual increase until it plateaus before mirroring the process as it descends. This sprint structure allows for a consistent work load that produces consistent results and accounts for associated risks.
A company should use this ideal sprint structure to create sustainable workflows. Spend time planning and prepping for each step in the sprint. This will create a stability that ensures there are periods where our associated risk is at its lowest because the level of effort is consistent and stable. The ideal sprint is successful because its moments of lowest risk are at the beginning–during the initial planning– in the middle, during the period when the team is maintaining the peak level of effort. This curve is quite the opposite of a typical sprint.
Our thinking is not rocket science, but it takes on the same principles. We test while we fly and fly while we test, but not before we properly plan our trajectory. The ideal sprint will align with the needs of your team and the needs of your customers.
Matt Zimmer, Novvum’s CEO, says it best: “Ramping up fast–what the math shows–ramping up fast induces risk. Sustaining output once we’re there, we’ll do it all day long, but it takes time to get the machine moving.”
A consistent workflow guarantees a satisfactory experience for the customer. A calculated workflow guarantees a satisfactory experience for the development team. It’s all about balance.


